
Estimated reading time: 8 minutes
By Innoventra Insights
A sales dashboard shows that revenue has fallen by 7%.
A conventional dashboard leaves the executive to investigate what happened.
An AI dashboard can go further. It may identify that most of the decline came from one customer segment, connect it to a recent increase in delivery times, estimate the revenue at risk next quarter and recommend which accounts should receive immediate attention.
That distinction explains why organisations are investing in AI-powered dashboards, conversational analytics and decision intelligence.
The dashboard is no longer merely a screen filled with charts. It is becoming an analytical system capable of finding anomalies, explaining performance, forecasting likely outcomes and helping leaders decide what to do next.
But the transition is not automatic. McKinsey reported in 2026 that although 88% of surveyed organisations had deployed AI in at least one business function, 94% had still not achieved significant enterprise-level EBIT impact. The evidence suggests that purchasing an AI tool is relatively easy; redesigning decisions, data and workflows around it is considerably harder.
What Is an AI Dashboard?
An AI dashboard is a business-intelligence interface that uses artificial intelligence, machine learning or natural-language processing to analyse data and communicate relevant findings.
A traditional dashboard usually presents predetermined metrics such as:
- revenue;
- expenditure;
- customer churn;
- operational performance;
- workforce numbers;
- delivery milestones.
An AI-powered dashboard can also:
- detect unusual changes automatically;
- explain which factors contributed to an outcome;
- forecast future performance;
- answer questions written in ordinary language;
- generate narrative summaries;
- model alternative scenarios;
- prioritise risks and opportunities;
- recommend possible actions.
IBM defines AI analytics as the use of artificial intelligence to interpret data and produce predictions or recommendations. Predictive AI applies statistical and machine-learning techniques to identify patterns and anticipate future events or risk exposure.
The result is a shift from descriptive reporting towards diagnostic, predictive and prescriptive analysis.
| Dashboard type | Primary question |
|---|---|
| Descriptive | What happened? |
| Diagnostic | Why did it happen? |
| Predictive | What is likely to happen next? |
| Prescriptive | What action should we consider? |
Why Are AI Dashboards Becoming Important?
The problem facing executives is rarely a shortage of data.
It is the delay between receiving information, understanding its significance and taking action.
A monthly performance pack may contain hundreds of figures, but leaders still need to determine:
- which change actually matters;
- whether it represents a temporary fluctuation or structural problem;
- what caused it;
- how much value is at risk;
- which intervention is most likely to work.
AI dashboards aim to reduce that decision latency.
Instead of requiring leaders to search manually through multiple reports, the system can monitor performance continuously and surface the changes most likely to require attention.
Gartner predicted in 2025 that half of business decisions could eventually be augmented or automated by AI agents. Its 2026 CEO survey found that 32% of respondents expected their organisations to deploy self-learning and adaptable AI tools to support human decisions, while another 27% anticipated predominantly autonomous operations.
These forecasts do not mean that AI will replace executive judgement. They indicate that a growing share of the evidence, analysis and scenario modelling surrounding decisions may be produced automatically.
How Are AI Dashboards Different From Traditional Business Intelligence?
Traditional business intelligence depends heavily on prebuilt reports.
An analyst decides which questions matter, defines the measures, creates the visualisations and distributes the dashboard. When an executive asks a new question, the analyst may need to revise the report, write another query or combine data from another system.
AI-powered business intelligence makes the interaction more dynamic.
An executive could ask:
Why did customer churn rise in the North-West this quarter?
The system may then:
- interpret the business meaning of “churn” and “North-West”;
- query the relevant governed datasets;
- compare the result with previous periods;
- identify correlations or likely drivers;
- create an appropriate visualisation;
- produce a concise explanation;
- suggest additional questions.
Microsoft says Copilot in Power BI can answer questions about governed data, create and analyse visuals, summarise reports and help users conduct ad hoc analysis through natural language. Google’s Looker Conversational Analytics similarly uses a governed semantic model as its source of truth, allowing business definitions such as “revenue” or “churn” to be interpreted consistently.
That semantic layer is crucial. Without agreed business definitions, two departments may calculate the same metric differently—and an AI system can produce a confident answer based on the wrong interpretation.
What Can an AI Executive Dashboard Actually Do?
1. Detect anomalies before they become obvious
AI can monitor large numbers of measures and identify unusual movements that an executive might miss.
Tableau Pulse, for example, automatically detects trends, drivers and outliers, then presents them through natural-language and visual explanations. This changes the dashboard from a passive destination into a system that actively alerts users to significant changes.
A retailer might be alerted that:
- returns have risen unusually quickly;
- the increase is concentrated in one product range;
- most affected orders came from a specific supplier;
- the trend could reduce quarterly margin if it continues.
The executive no longer has to discover the issue by chance.
2. Explain why performance changed
Most dashboards are good at showing that a number moved but poor at explaining why.
An AI dashboard can compare variables across:
- products;
- regions;
- customer groups;
- channels;
- time periods;
- operational processes.
It may not prove causation, but it can narrow the investigation by identifying the factors most strongly associated with the change.
3. Forecast future outcomes
Predictive models can estimate:
- likely revenue;
- inventory requirements;
- customer churn;
- cash-flow pressure;
- project delays;
- fraud risk;
- workforce demand.
The strongest dashboards also show uncertainty. A forecast without a confidence range can appear more precise than the underlying evidence allows.
4. Support “what-if” analysis
Executives often need to compare decisions before committing resources.
An AI dashboard might model questions such as:
- What happens to profit if supplier costs rise by 8%?
- Which projects should be delayed if the budget falls by £5 million?
- How would customer retention change if response time improved by 20%?
- What is the likely effect of closing an underperforming location?
Amazon says its AI-powered analytics tools can support natural-language scenario analysis and “what-if” questions, while generating executive summaries from dashboard data.
The purpose is not to predict the future perfectly. It is to expose assumptions and compare possible consequences before action is taken.
5. Turn dashboards into conversations
Natural-language analytics can make organisational data accessible to people who cannot write SQL or build reports.
Instead of navigating filters and charts, an executive may ask:
- Which customers are most likely to leave?
- Why is operating expenditure above forecast?
- Which teams have the largest recruitment gap?
- Where are we likely to miss next quarter’s target?
- What changed after the pricing decision?
Google, Microsoft, Tableau, IBM and Amazon are all developing conversational analytics capabilities that allow users to ask questions, generate visualisations or receive narrative explanations from governed business data.
What Are the Business Benefits of AI Dashboards?
The commercial value does not come from producing more charts.
It comes from improving a decision or reducing the effort required to reach it.
Potential benefits include:
Faster access to insight
Business users can answer some questions without waiting for an analyst to create a new report.
More proactive risk management
AI can surface deteriorating performance before it reaches a formal reporting threshold.
Lower reporting effort
Narrative summaries, recurring analysis and basic visualisations can be produced automatically, allowing analysts to spend more time testing assumptions and investigating complex issues.
Better focus
Exception-based reporting can direct executive attention towards the handful of metrics that genuinely require intervention.
Wider access to analytics
Natural-language interfaces can allow operational managers and non-technical leaders to explore data directly.
There is emerging evidence that modernised analytics can produce measurable operational improvements. IBM reports examples including an 86% improvement in reporting speed and accuracy for one customer, approximately one hour saved per supervisor each day in another case, and the replacement of four legacy systems with one enterprise application for the UK Ministry of Defence. These are vendor case studies rather than independent controlled trials, but they demonstrate the kinds of outcomes organisations are pursuing.
Why Do Many AI Dashboard Projects Fail?
The most important lesson is that an AI dashboard cannot repair unreliable data.
It can make poor information appear more persuasive.
Inconsistent metrics
If finance, sales and operations use different definitions of “revenue”, “customer” or “delivery”, the AI may produce contradictory answers.
Fragmented data
Critical information may be distributed across spreadsheets, customer systems, finance platforms and local databases.
Missing context
A model may detect that sales declined but not know that a product was deliberately withdrawn or a site temporarily closed.
Hallucination and overconfidence
Generative AI can produce fluent explanations that are not fully supported by the source data.
Automation bias
Executives may trust an AI recommendation simply because it appears quantitative or sophisticated.
Poorly designed dashboards
Adding AI to a dashboard containing 70 poorly chosen KPIs does not create decision intelligence.
Gartner argues that successful AI initiatives require substantial investment in data, analytics, metadata, semantics and contextual foundations. Its 2026 guidance describes context as the “brain” required for AI agents to produce trusted intelligence.
McKinsey similarly found that AI high performers are more likely to establish clear processes defining when model outputs require human validation.
Can Executives Trust AI Dashboard Recommendations?
They should trust them conditionally, not automatically.
A credible executive dashboard should show:
- the data sources used;
- when the data was last refreshed;
- how the metric was defined;
- the assumptions behind the analysis;
- the confidence level of a forecast;
- the factors influencing a recommendation;
- whether human validation is required;
- whether any relevant data was excluded.
A recommendation such as “reduce marketing expenditure by 10%” is unsafe without context.
A stronger dashboard would explain:
Paid-search acquisition cost rose 18% over six weeks, while conversion declined 9%. The model estimates that reallocating 10% of expenditure to the highest-performing retention campaign could improve quarterly contribution by between £240,000 and £390,000. Confidence: moderate. Assumption: conversion rates remain within their previous 12-month range.
The second version allows an executive to challenge the assumptions rather than merely accept the conclusion.
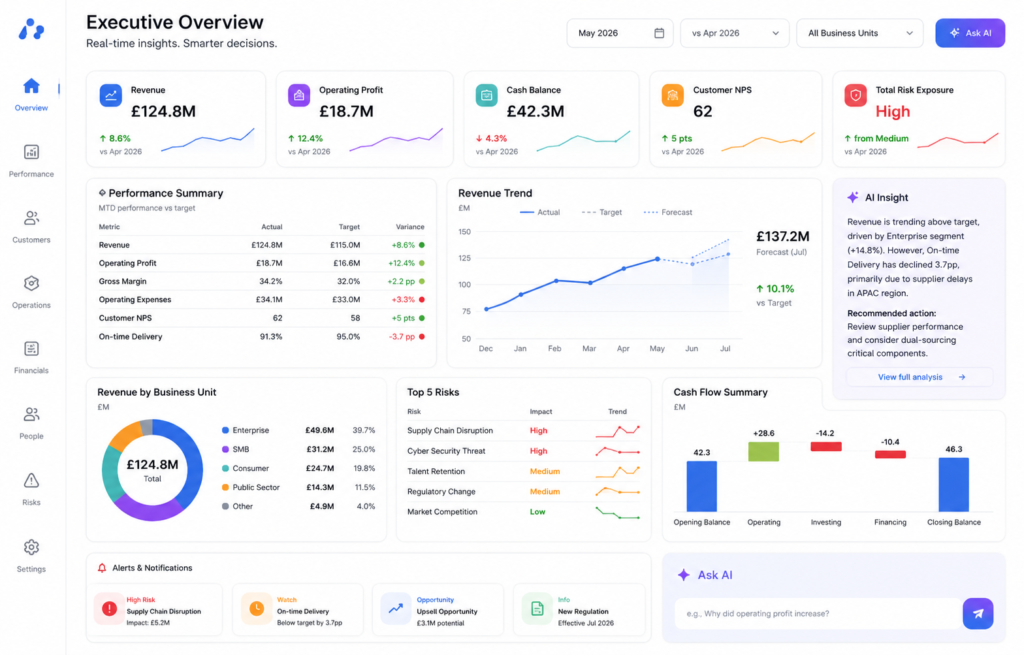
What Should an Effective AI Executive Dashboard Include?
A useful dashboard should not attempt to show everything.
It should contain five layers:
| Layer | Executive purpose |
|---|---|
| Performance | Are we on target? |
| Exceptions | What requires attention? |
| Explanation | Why has it changed? |
| Forecast | What is likely to happen? |
| Action | What decisions should be considered? |
The most valuable design features include:
- a limited number of strategic KPIs;
- alerts based on materiality rather than every fluctuation;
- plain-English explanations;
- drill-down capability;
- confidence scores;
- visible data lineage;
- scenario modelling;
- named decision owners;
- links between insights and actions;
- records of whether recommendations produced results.
That final point matters. An intelligent dashboard should eventually learn not only which patterns predict outcomes, but which organisational interventions actually work.
Which AI Dashboard Tools Are Leading the Market?
The main enterprise platforms include:
- Microsoft Power BI Copilot, for natural-language exploration, report summaries and AI-assisted analysis;
- Tableau AI and Tableau Pulse, for automated insights, anomalies and conversational analysis;
- Google Looker with Gemini, for governed conversational analytics;
- Amazon QuickSight with Amazon Q, for natural-language dashboards, executive summaries and scenario analysis;
- IBM Cognos Analytics and watsonx BI, for governed enterprise reporting and predictive business intelligence;
- ThoughtSpot, for search-led and AI-assisted analytics.
The best platform depends less on which demonstration looks most impressive and more on:
- compatibility with existing systems;
- quality of the organisation’s semantic model;
- security and access controls;
- data residency requirements;
- auditability;
- integration costs;
- user adoption;
- total cost of ownership.
How Should an Organisation Introduce AI Dashboards?
A sensible implementation begins with one important decision not an enterprise-wide technology purchase.
Step 1: Select a high-value decision
Choose a recurring decision where faster or better analysis has measurable commercial value.
Step 2: Define the required evidence
Identify which metrics, documents, external signals and operational data inform that decision.
Step 3: Resolve data-quality problems
Agree definitions, ownership, refresh cycles and access controls before adding generative AI.
Step 4: Establish a baseline
Measure how long the current decision takes, how accurate forecasts are and what poor decisions currently cost.
Step 5: Introduce human-reviewed AI support
Allow AI to explain, forecast and recommend, but retain a named human decision-maker.
Step 6: Measure business outcomes
Track whether the dashboard improved speed, accuracy, revenue, cost, risk or customer outcomes.
Step 7: Scale only after proving value
An attractive interface is not evidence of transformation.
The project should expand only when it improves a measurable organisational outcome.
Will AI Dashboards Replace Business Analysts or Executives?
They are more likely to change both roles.
Analysts will spend less time:
- producing repetitive charts;
- manually summarising performance;
- responding to elementary data requests;
- rebuilding similar reports.
They will spend more time:
- validating data;
- testing causal explanations;
- designing metrics;
- assessing model reliability;
- challenging assumptions;
- translating analysis into business action.
Executives will also need a different skill: knowing how to interrogate an AI-generated conclusion.
The competitive advantage will not belong to the leader who accepts recommendations fastest. It will belong to the leader who asks the best questions, recognises uncertainty and understands when human experience should override a model.
The Future of AI Dashboards
The next generation of dashboards will probably become less visible, not more elaborate.
Instead of requiring leaders to open a separate reporting platform, insights may appear inside email, collaboration tools, planning systems and operational workflows.
A system could detect a potential supply shortage, estimate the affected revenue, identify alternative suppliers, prepare a recommended response and ask the responsible director for approval.
Recent research also points towards dashboards that preserve analytical context across both visual interaction and conversation. One 2026 study reported that an integrated dashboard-and-agent approach improved exact-match task accuracy from 43.3% to 63.3% compared with a dashboard-only system, while substantially reducing timeouts. The research is early and should not be generalised across all business settings, but it illustrates the value of connecting conversational AI to visible, traceable dashboard states.
The dashboard is therefore evolving through three stages:
Reporting system → decision-support system → supervised action system
Final Verdict
AI dashboards can make business intelligence faster, more accessible and more proactive.
They can detect hidden changes, explain performance, forecast outcomes and help leaders compare possible actions. But they do not create value merely because they contain artificial intelligence.
The organisations most likely to benefit will be those that:
- begin with important business decisions;
- build trusted data foundations;
- define metrics consistently;
- show uncertainty transparently;
- preserve human accountability;
- measure whether recommendations improve results.
The future executive dashboard will not simply tell a board that performance has changed.
It will explain why, estimate what could happen next, identify the decisions that matter most—and show enough evidence for a human leader to decide whether the machine is right.